Showing posts with label 200EMA. Show all posts

Friday, 27 November 2020

Punjab Alkalies and Chemicals Ltd (PACL)- A Tale of Triple Support and Promising Signals

Hello Readers!

Punjab Alkalies and Chemicals Ltd. (PACL) fell almost 75% from its lifetime high of 85 and took support at 21.50. 

Since that bottom, PACL has ensured in an uptrend

RSI is in the bullish range oscillating in the 40-80 range from the previous bearish range of 20-60


PACL is currently on the support trendline it has respected on the past three occasions as circled in green 


A closed look at the daily chart below indicates that the support is very strong due to 3 reasons:

1) The presence of the 200 EMA (exponential moving average) is a strong technical indicator and has often proven to be a reliable one.

2) During the last leg up PACL broke out above the 200EMA with a gap up (highlighted by the circle), and is now on the same level, making this a psychologically important level and therefore a potential price support

3) The up-trendline as discussed above and highlighted by an arrow in the chart below is, of course, evident support. 
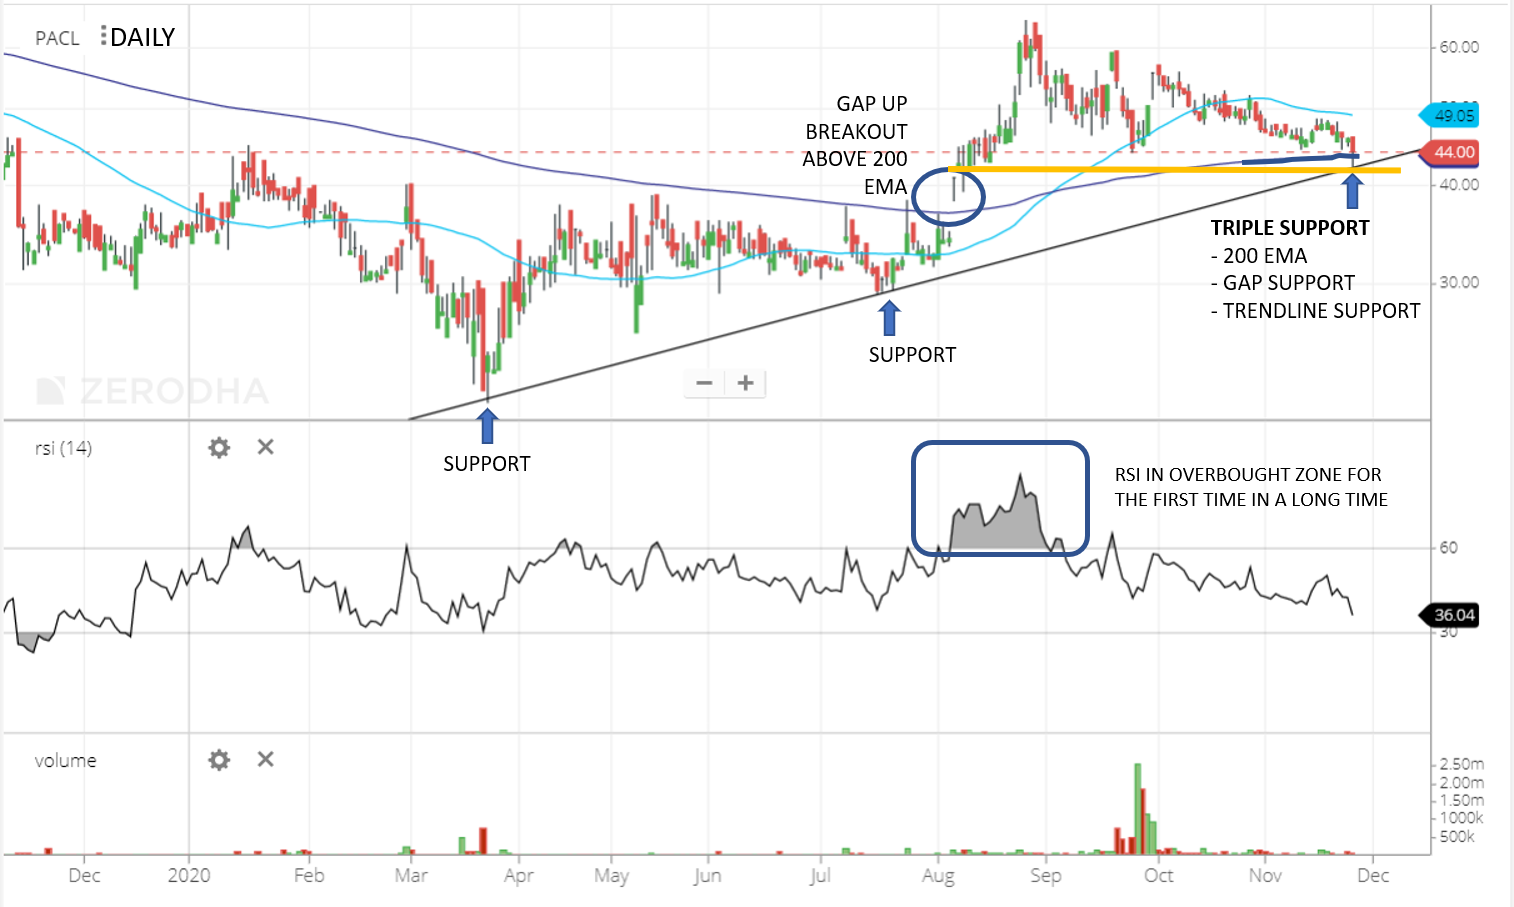


These pieces of evidence from the moving average, trendline, gap ups, and most importantly, from RSI, when grouped together, are enough to hope that the stock will reverse and trend higher. 


To provide for whiplash, I would lookout for a closing lower than Rs. 38 in the stock to reconsider the analysis, but until then, I will continue to be hopeful of the stock scaling up to Rs. 85 again. That is a potential upside of 88% from the current stock price of Rs. 45!


Thank you for reading, please leave your comments below if you enjoyed it. 

Choose the platform you use the most and follow the link to follow Let's get Technical on the go!

Blog: https://goo.gl/qd2jDG
Twitter: http://bit.ly/2QLoQm6
Facebook: http://bit.ly/2RQErlN
LinkedIn: https://bit.ly/2QR4ZBY
Instagram: https://goo.gl/ftYub6


Regards,
Kavita Chamaria
kchamaria1993@gmail.com


Wednesday, 12 August 2020

CRUDE OIL: The damp days to return, another price decline on the charts

 Hello Reader!

While the world grapples with the aftermath of COVID-19, the business and finance world is struggling to adjust to the new realities as well. With lowered top-line across most of the businesses, the emergence of new sectors, higher digitalization stands to threaten several status quo previously prevalent. over the next year, we will witness many businesses go down the same path producers of chariot whips and boot heels for men did. Evolution is the key to survival for businesses. 

But what about the cost? The lowered crude oil price has send many businesses into a frenzy. Government and businesses have openly filled in their crude oil reservoirs with what they perceived as never to return cheap prices. However, what if I told you that the lower prices were returning soon? 

A simple technical analysis of the crude oil charts across different time frames has a well-knit story of the downtrend which has been unfolding on the charts of crude oil since the crash in 2007.

Crude Oil stands at $41.8 per barrel. This is historically a very important price zone. On several different occasions in the past, crude oil has taken support at this level as highlighted in the chart below. Now, with the world being a very different place, $41.8 is posing as a strong resistance. This fungible nature of price levels is quite commonly observed across stock indices, individual stocks, currencies, and commodities. 

Crude Oil price Analysis

                                    Crude Oil: Monthly Chart- Period shown : 2009 to 2020


Lower-highs, lower-lows have been observed in crude oil post the 2007 crash. The Primary trend has been down with intermittent rallies. Since April 2020, one such minor trend upside rally has been witnessed.


A quick glance at RSI shows how a penetration below the level of 30 has meant more bad news for crude oil. Back in Dec 2014 when RSI broke below the level of 30, prices could only temporarily recover after that. Soon in Jan 2016, crude oil forged a new price low after falling 50% from its recent high of $61 to $27 per barrel.

History can be seen repeating itself. Today, crude oil price stands at the strong resistance zone of $42 PB, with lost momentum and at the edge of a cliff. It is only a matter of time when crude oil prices will fall again and forge a new below $20.  We are discussing the possibility of a 50% price slide from the current levels as indicated by RSI. 


                                    Crude Oil: Weekly Chart- Period shown: 2009 to 2020


After having looked at the monthly and weekly charts of Crude Oil, the story recited by the Daily chart is no different. It reverberates the eminent message of downfall by means of the Negative Divergence between price and RSI. Negative divergence is an indication of lost price momentum. It is especially potent when it occurs close to an important price resistance (like $42 in this case) after a prolonged rally.

All across the time horizons- monthly, weekly, and daily, the tale of weakening crude oil prices can be heard loud and clear. It is best to be cautious and brace ourselves for what is to follow. The pain of hammered crude oil price is going to resume.


                                    Crude Oil: Daily Chart- Period shown: March 2020 to Aug 2020. 


 That's all on crude oil. 

Thanks for reading!

Choose the platform you use the most and follow the link to follow Let's get Technical on the go!


Regards,

Kavita Chamaria

kchamaria1993@gmail.com


Monday, 8 April 2019

REC Ltd follow up- 34% return and counting

Hello Readers:

Since the first post on REC Ltd (HERE) the stock has return over 34%. It touched Rs155 recently. I am sharing below a quick update on the call.

Please share you feedback/queries if any

Email: kchamaria1993@gmail.com

Rec Ltd. Weekly chart. After a strong rally, a temporary correction may now ensue before continuation.