Friday 28 August 2015

NIFTY headed for deeper water!

"MARKET KYA LAG RAHA HAI?"--- This is the most repeated question of the year 2015 following the 9116.95 high on 04th March 2015. 

Below is an attempt to answer this question.

The market is clearly in a correction(for the better) . It is being said the Indian Economy will take over China in leading Global growth. I believe its true. But does that imply that the Indian market indices are invincible? Nope!
What is begun, has to end. The correction which is underway will see completion.

Below is a detailed Elliot Analysis of Nifty.

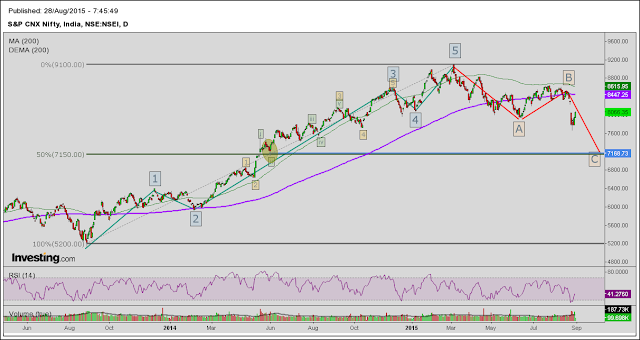
The Primary bull run that started from September 2013(~5200) ended on March 2015(~9100) registered a rise of nearly 4000 points. This rise encapsulated the proper 5 waves structure as laid out by Sir R.N.Elliot

NIFTY SPOT Daily Chart , Dated- 28th August 2015. Elliot count on Nifty.
I am pinning on the 7200 level because of the following reasons:

      1.7200 level is the level of wave ii 3 [3] as highlighted by the ellipse on the chart below.

      2. A ~50% Fibonacci of the entire primary wave gives us the level of 7150 .

      3. There is always a Fibonacci relation between the lengths of Wave A and Wave C. Wave A was exactly 1180 points (9120-7940) . I'm expecting Wave C be 1460 points long. That is 1180 x 123.60%(a Fibonacci level) = 1458.48. So from the level of 8655(previous high), 8655-1460=7195.
NIFTY SPOT, Daily Chart, dated: 28/08/2015. Showing Elliot breakup. 
   
Such clustering of evidence around 7200 add weight-age to the level. 

Below is a breakup of the corrective Wave A-B-C reflecting Nifty at its current level of resistance which is exactly 61.8% of the the Wave 1 so far into the primary Wave C.  

NIFTY SPOT 4H Chart dated- 28/08/2015. Fibbonacci Levels and Elliot Wave analysis

Few levels taken for the analysis maybe off by 10-20pnts. But in my understanding they do not hamper the reliability of the Elliot and Fibonacci tools. It would be very interesting to note than ever since Nifty has hit the 9000 high, the RSI indicator has evidently undergone a range shift. Early the indicator would cross the 70 mark and stay shy of 40, but at 9000, the indicator did not pass above 60 and also broke the 40 mark to take support at 30 several times. 

These elements help in judging the pulse of the market and are crucial for analysis.

Thank you reading. 

Please feel free to comment on the analysis.

Anyone seeking detailed analysis on any security , preferably stock/currency/commodity, may email me their requirements at kchamaria1993@gmail.com. I'll try my best to help you with my analysis.


Wednesday 19 August 2015

Something on the Currencies: USDINR, USDEUR, EURINR

Hello Readers!

Here's a post on a few currencies of the world as we know them. The dollar, the Euro and of course the Rupee.

The EURINR chart is range bound. having formed the triple top formation on the chart, with resistance at 73, the EURINR has begun to dip again. While looking at the bigger picture and a parallel analysis of the USDINR and USDEUR we see that Rupee seems to be getting stronger against Dollar, while Euro is giving signal of getting weaker against Dollar in the coming days.

Hence we can assum with evidence that Rupee will strengthen against the Euro.
If this happens then there will not be a breakout on the eurinr chart beyond the range of 73 , as also indicated by the momentum indicator, RSI, which has reached the zone of 70 and failed to breached it, which is a very bearish sign.
so we have a three fold hold on these currency pairs name usdeur, eurinr and usdinr.
USDINR- Bearish
EURINR- Bearish
USDEUR-Bearish.  

Add caption


The individual Chart analysis is as follows.

EURINR

Currently undergoing a choppy movement between the range of 73.0 and 68.50, there is evidence on the charts to believe that the INR will strengthen against the EUR and pave way for the support zone of 68.50. whether it completes the journey to tthe support level or not is a matter of time, but individual analysis tells us that there will not be a breakout above the zone of 73.0 atleast in this movement. 
Moreover the RSI has given a top of 69.0474, just shy of 70, a bad signal. 

EURINR daily chart last updated 18-8-2015

 USDEUR


What we see in the USDEUR chart is called the measuring move, wherein a sharp movement in one directed is interjected by a correction in the opoosite direction somewhere in the middle of the entire move. So here, the red downfall from 0.920 to 0.892 was just half the movement and soon we may witness a fall of the same magnitude - heading for the support blue line around 0.880.

USDEUR daily chart , last updated 18-8-2015

 USDINR

The last candle on the chart is called a doji. Due to owning the EOD verison, I am unable to present you with the updated chart here which would contains today's movement also, which has given a lower closing than the last candle in this chart which is called a dragonfly DOJI, an indicator of indecision and probable weakness when appearing at tops.  This indicates that the Rupee has good probability of owning up strength against the Dollar. 
Again RSI in the chart is pretty overbought, not as insistent as in the USDEUR chart, but still, it does indicate chances of a correction here. 

USDINR daily chart, last updated 18-8-2015

Please feel free to comment on the analysis.

Anyone seeking detailed analysis on any security , preferably stock/currency/commodity, may email me their requirements at kchamaria1993@gmail.com. I'll try my best to help you with my analysis.


Saturday 1 August 2015

Technical lead on ACC


For the first time, I've decided I'll share my analysis on a stock. Please note: these are my observations, you are welcome to go along with it , but on your own discretion, I undertake no liability.

ACC

CMP- 1387.40, target price- 1530, stoploss- 1355. 

Below is the daily chart ACC cement which seems like it could rise from the Friday's closing of 1387.40 to a good 1530 in the coming days.
The evidences behind such observations are:
1. RSI has bounced from 30 and is headed higher
2. Good volumes on the previous day 
3. RSI stochastic has recently crossed over the 30 zone and is heading higher, which is a thumps up.

stock: ACC. period: DAILY. DATE: 31ST JULY 2015. Indicating a good upmove from 1387 to 1530.
Keeping it precise. Follow up for more stocks and Nifty view for the coming week.