Hello Readers!
Punjab Alkalies and Chemicals Ltd. (PACL) fell almost 75% from its lifetime high of 85 and took support at 21.50.
Since that bottom, PACL has ensured in an uptrend.
RSI is in the bullish range oscillating in the 40-80 range from the previous bearish range of 20-60
PACL is currently on the support trendline it has respected on the past three occasions as circled in green

A closed look at the daily chart below indicates that the support is very strong due to 3 reasons:
1) The presence of the 200 EMA (exponential moving average) is a strong technical indicator and has often proven to be a reliable one.
2) During the last leg up PACL broke out above the 200EMA with a gap up (highlighted by the circle), and is now on the same level, making this a psychologically important level and therefore a potential price support
3) The up-trendline as discussed above and highlighted by an arrow in the chart below is, of course, evident support.
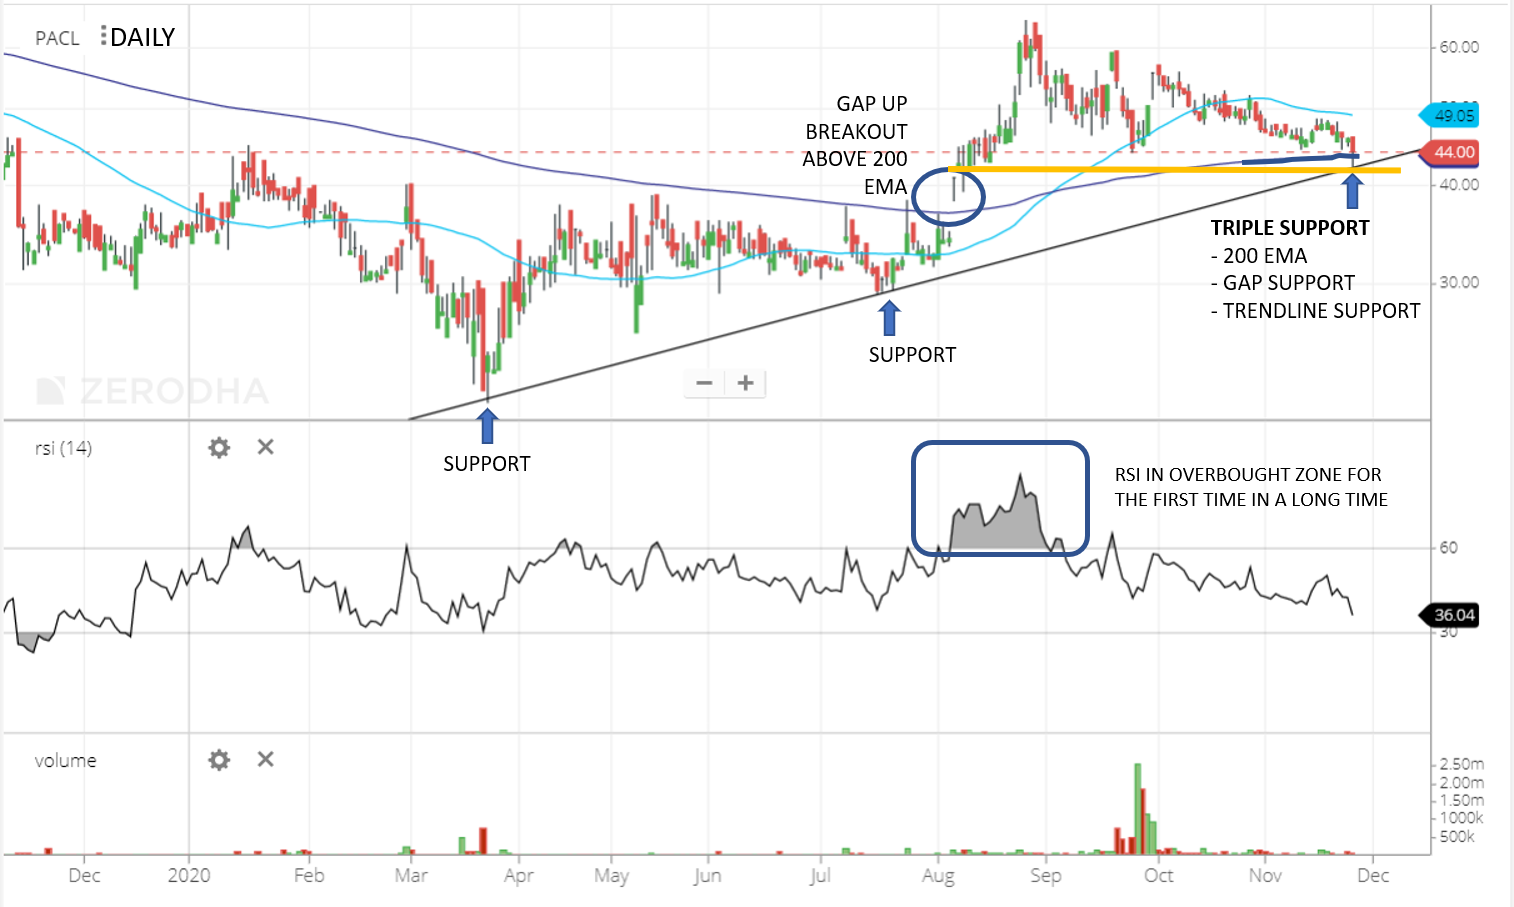
These pieces of evidence from the moving average, trendline, gap ups, and most importantly, from RSI, when grouped together, are enough to hope that the stock will reverse and trend higher.
To provide for whiplash, I would lookout for a closing lower than Rs. 38 in the stock to reconsider the analysis, but until then, I will continue to be hopeful of the stock scaling up to Rs. 85 again. That is a potential upside of 88% from the current stock price of Rs. 45!
Thank you for reading, please leave your comments below if you enjoyed it.
Choose the platform you use the most and follow the link to follow Let's get Technical on the go!
Blog: https://goo.gl/qd2jDG
Twitter: http://bit.ly/2QLoQm6
Facebook: http://bit.ly/2RQErlN
LinkedIn: https://bit.ly/2QR4ZBY
Instagram: https://goo.gl/ftYub6
Regards,
Kavita Chamaria
kchamaria1993@gmail.com
No comments:
Post a Comment
Your comment is highly appreciated!